After accessing the Robotics Digital Twin with the remote desktop, you will see a layout similar to the following figure (Figure 1).

Figure 1. Overview of the environment.
Here you can see the 3 main parts of the Digital Twin.
⦁ The first one is the code editor, here you will write and execute the code.
⦁ The second one is a live feed of a webcam. Here you can see the real robot in the lab.
⦁ The third one is the Digital Twin program. This is the bridge between the code and the real robot.
In the exercises and classes, you will learn how to use commands to control the robot. These commands can also be found in the documentation.
To write some custom code, do it in the main function that is on the index.js file. We recommend that for the purposes of the exercises, you write all the code on this file, separating some behaviour in functions if needed, as shown in figure 2.
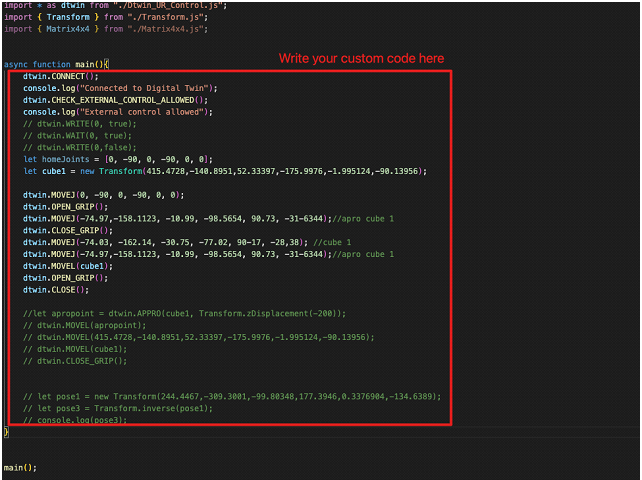
To run the program that you wrote, use the following command on the console inside visual studio code:
![]()
The program may not work if the Digital Twin is not in the correct state. The program should show a warning if so. To understand how to set up the digital twin to be used with custom code, refer to the «Remote Tab» character in this documentation.
You can rotate the camera holding right click, as well as zoom using the scroll wheel.
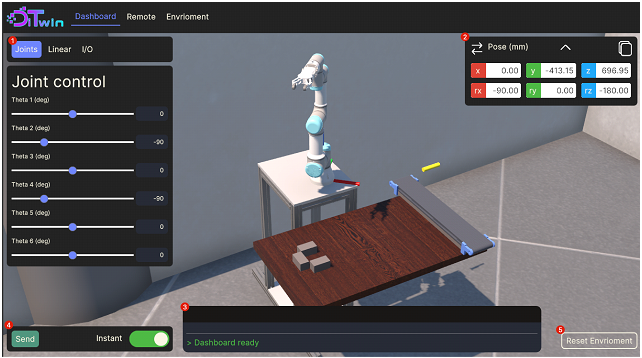
Figure 3. The Dashboard Tab with the different sections numbered.
Firstly, the left panel, marked as 1 on Figure 3, is the main control of this tab. Is separated on three other tabs, each offering a different way to interact with the Digital Twin.
On the Joint Control Tab, seen in Figure 3, you can move the current joint positions of the robot.
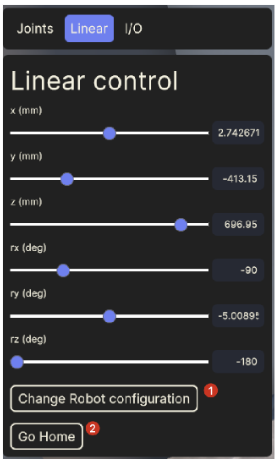
Figure 4. Linear control tab inside the Dashboard
On Figure 4 you can see the Linear control tab. Here you can move the current TCP position of the robot. There are also two buttons, marked with 1 and 2 on the Figure 4. The button number 2, with the label “Go Home”, will move the robot to the home position. The button marked as 1, will open the robot configuration menu, as seen in figure 5. On this menu, you can change the current configuration of the robot.
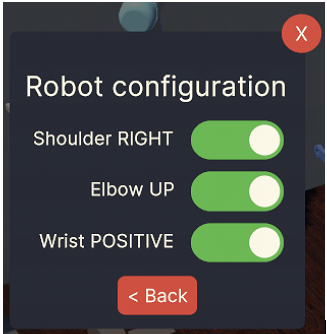
Figure 5. Robot configuration Menu.
On the I/O tab, seen in Figure 6, you can control the Digital Outputs of the robot and the Tool, as well as seeing the state of the digital Inputs. The Digital Output 0 is the conveyor belt START signal, the Digital Output 1 is the conveyor belt DIRECTION signal, and the Digital Input 0 is the proximity sensor.
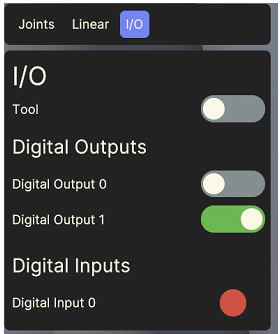
Figure 6. I/O Tab inside the Dashboard.
Taking a look back to the whole dashboard screen, and marked as 2 in Figure 3, is the current position indicator. You can press the arrow button, marked as 1 on Figure 7, to change the way you see the current position. If you press the copy button, marked as 2 on Figure 7, you will copy this current position on the format accepted by the code.
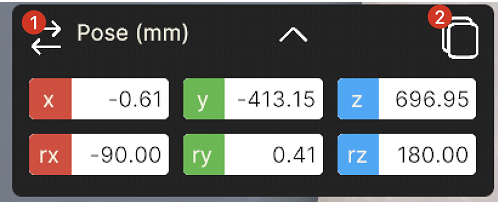
Figure 7. Current Position Indicator inside the Dashboard.
Marked as 3 on Figure 3, is the console output. This will show some relevant information about the digital Twin, like an unreachable pose, as seen in Figure 8.
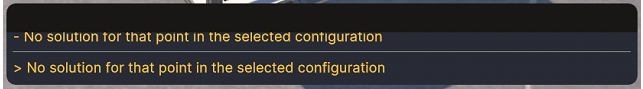
Figure 8. Console output of Dashboard Tab showing an unreachable position.
Marked as 4 on Figure 3 is the Send Button zone. This zone contains also the instant toggle button. This button changes the behaviour of the previous control tabs, and is used to see the movement of the robot, instead of making it act instantly when you move the sliders. When it is toggled off, you can freely move all the sliders, and then tab the “Send” button.
Marked as 5 on Figure 3, is the reset environment button. This way you can reset the cubes to the original position.
The remote tab, and overview of which you can see on Figure 9, is used to interact with the Digital Twin through code.

Figure 9. The Remote Tab.
- Marked as 1 on figure 9, is the I/O visualizer. Here, you can see the current state of all the input and outputs of the system.
- Marked as 2, is the connect button. This is used to connect to the real robot.
- Marked as 3, is the Allow External Control button. This is a safety measure, and if this button is not pressed, no external program will be able to run.
- Marked as 4, is the Simulation Mode toggle. This toggle indicates whether the code sended to the Digital Twin will be executed in simulation mode or it will be sent to the real robot.
- Marked as 5, is the output console, akin to the one on the Dashboard screen, it will show some information.
- Marked as 6, you can see the current state of the connection to the real robot.
- Marked as 7, is an emergency stop button. It works both on simulation mode and on the real robot.
The environment tab, seen on Figure 10, is a simple menu where you can select the current state of the environment, separated by exercises. This will correspond to the exercises shown on the lessons. There are also some graphical settings, to show and hide the Gizmos of the TCP and Robot base.
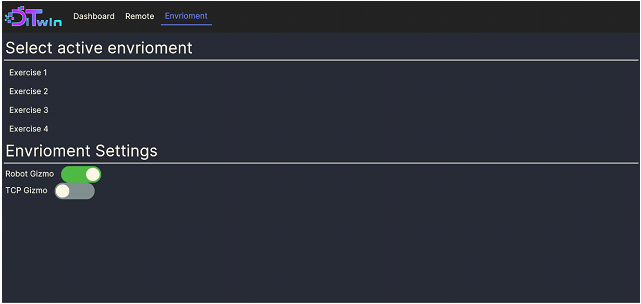
Figure 10. The environment tab.